Profiling Processing Resources
This is a reporting tool for GATE processing resources. It reports the total time taken by processing resources and the time taken for each document to be processed by an application of type corpus pipeline.
GATE use log4j, a logging system, to write profiling informations in a file. The GATE profiling reporting tool uses the file generated by log4j and produces a report on the processing resources. It profiles JAPE grammars at the rule level, enabling the user precisely identify the performance bottlenecks. It also produces a report on the time taken to process each document to find problematic documents.
Features
- Ability to generate the following two reports
- • Report on processing resources. For each level of processing: application, processing resource (PR) and grammar rule, subtotalled at each level.
- • Report on documents processed. For some or all PR, sorted in decreasing processing time.
- Report on processing resources specific features
- • Sort order by time or by execution.
- • Show or hide processing elements which took 0 milliseconds.
- • Generate HTML report with a collapsible tree.
- Report on documents processed specific features
- • Limit the number of document to show from the most time consuming.
- • Filter the PR to display statistics for.
- Features common to both reports
- • Generate report as indented text or in HTML format.
- • Generate a report only on the log entries from the last logical run of GATE.
- • All processing times are reported in milliseconds and in terms of percentage (rounded to nearest 0.1%) of total time.
- • Command line interface and API.
- • Detect if the benchmark.txt file is modified while generating the report.
Limitations
Be aware that the profiling doesn’t support non corpus pipeline as application type. There is indeed no interest in profiling a non corpus pipeline that works on one or no document at all. To get meaningful results you should run your corpus pipeline on at least 10 documents.
Graphical User Interface
The activation of the profiling and the creation of profiling reports are accessible from the ‘Tools’ menu in GATE with the submenu ‘Profiling Reports’.
You can ‘Start Profiling Applications’ and ‘Stop Profiling Applications’ at any time. The logging is cumulative so if you want to get a new report you must use the ‘Clear Profiling History’ menu item when the profiling is stopped.
Be very careful that you must start the profiling before you load your application or you will need to reload every Processing Resource that uses a Transducer. Otherwise you will get an Exception similar to:
java.lang.IndexOutOfBoundsException: Index: 2, Size: 0
at java.util.ArrayList.RangeCheck(ArrayList.java:547)
at java.util.ArrayList.get(ArrayList.java:322)
at gate.jape.SinglePhaseTransducer.updateRuleTime(SinglePhaseTransducer.java:678)
Two types of reports are available: ‘Report on Processing Resources’ and ‘Report on Documents Processed’.
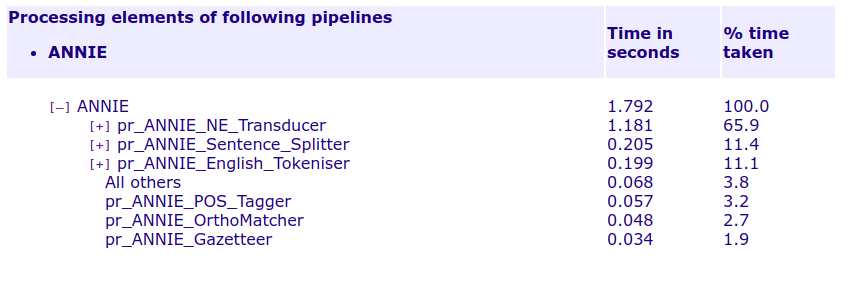
Report on Processing Resources(ANNIE)
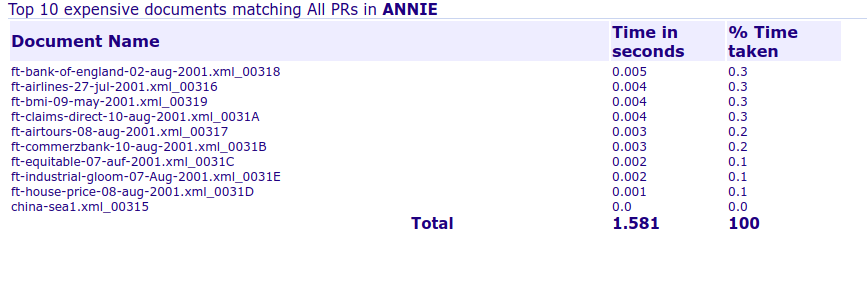
Report on Documents Processed
Thank You
Document By: Anusha Annapragada