SQL Profiler
OverView
You can use the SQL Profiler tool to debug, troubleshoot, monitor, and measure your application's SQL statements and stored procedures. SQL Profiler captures activity occurring in SQL Server, driven by requests from your client application.
The tool enables you to select precisely which events you want to monitor. For example, you might want to see when stored procedures are called, when they complete, how long they take to execute, how many logical reads occur during execution, and so on. You can also filter the trace, which is particularly useful when your database is under heavy load and a large amount of trace information is generated. SQL Profiler provides a set of templates with predefined event selection criteria. The templates are designed to capture commonly required events. You can modify and extend the templates or create your own. Trace data can be displayed interactively, or it can be captured directly to a trace file or database table.
Introduction
Microsoft SQL Server Profiler is a graphical user interface to SQL Trace for monitoring T-SQL Statements of Database Engine. We can save and reuse the state at a later point of time.
- We can do the following using SQL Server Profiler
- Create a trace
- Watch the trace results as the trace runs
- Store the trace results in a table
- Start, stop, pause, and modify the trace results as necessary
- Replay the trace results
- Use SQL Server Profiler to monitor only the events in which you are interested.
Menu Path: Start | All Programs | Microsoft SQL Server 2005 | Performance Tools | SQL Server Profiler.
The following screen will come:
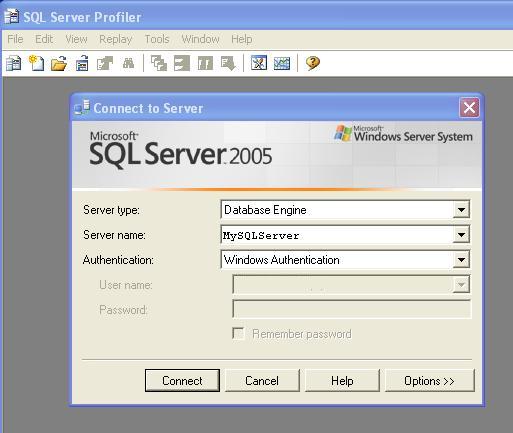
Click on <Connect> Button. New Properties Screen will come:
It has two selection tabs:
- General: It is used for general setting for Trace Database Engine.
- Event: It is used to add or remove some selected event for monitor.
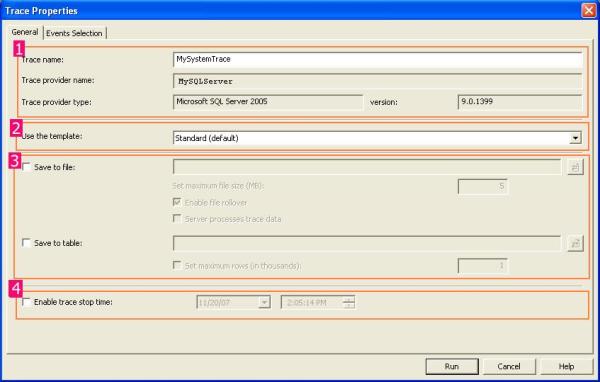
In General Section (as given in Figure 1.1), it is divided into four sections.
Section 1: In this section, you have to just specify the name of your trace, Trace provider name and server name are predefined and based upon your SQL Server.
And it is not editable.
Section 2: It is the template section. You can choose different type of Templates based upon your requirements. It is the configuration for trace. By default, it is "Standard (Default)" templates. Others templates are T-SQL, T-SQL Duration, T-SQL Reply, T-SQL SPs, etc. You can create your own custom Templates by selecting different Events and Event Class. It is saved as ".tdf" Extension.
Section 3: This section is related to save your trace. Either as File (.trc) or in a database. as table. While clicking on Save to file check box, File save dialog box should open and you can save that file (with .trc extension).
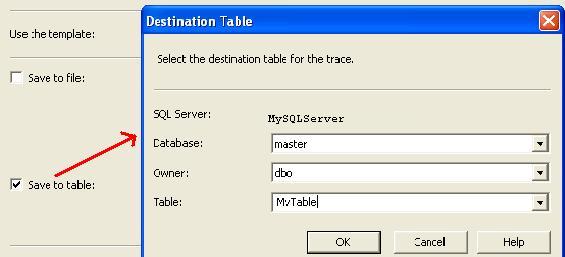
If you check the "Save to Table", it will connect with your server and ask you to which database you want to save that trace table information.
Section 4: You can stop your trace on a particular time. Check the "Enable trace stop time" checkbox and give the time at which you want to stop track, SQL Server will automatically stop trace on that time.
Now Move To "Event Section" Tab.
Now we need to know some definition with respect to SQL Server Profiler.
What is an Event?
An Event is an action or operation that is performed in your SQL Server 2005 Database Engine.
Some examples of Events are:
- Transact-SQL SELECT, INSERT, UPDATE, and DELETE statements.
- User login and logout
- Execution of Stored procedures
- Operation with cursor
SQL Server profiler is able to trace all of these events and all these events are categories on a particular Event class.
What is an Event Class?
Event class is a type of event that can be traced.
Some examples are:
- SQL: BatchCompleted
- SQL: Batch Starting
- Audit Login
- Audit Logout
- Lock: Acquired
- Lock: Released
Now you can select events from this screen:
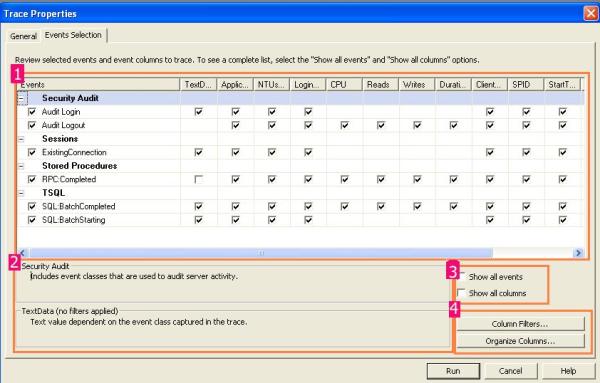
In section 1, we can select the proper check box based upon our requirement, section 2 will display the details of Selected events and Events class. If you check in the check box of section 3, you will get all the list of Events and Columns in Section 1.
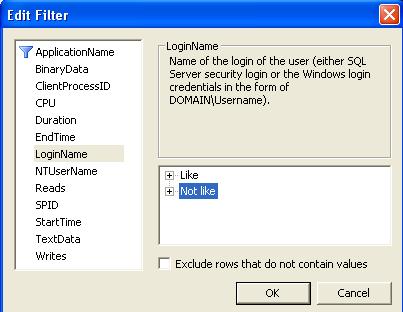
Section 4 is something like customization. Just click on the "Column Filter Button". In this section, you can specify some condition (like or Not like).
By clicking on "Organize Column" button, you can change the sequence of order of selected events.
Now Click on the "Run" Button, then Trace window will come:
Using these windows, you will get the detailed time duration of a query and all other events information that you have selected.
You can save this result and use it in future. Or you can extract a particular query from the trace, just right click and click on "Extract Event Data". And save this as a SQL Script.
Reply in SQL Server Profiler
SQL Server profiler has a Reply facility which has the ability to save a trace and replay it later.
Replay is useful to troubleshoot an application. Trace replay supports debugging by using Toggle Breakpoint and the Run to Cursor options on the SQL Server Profiler Replay menu.
Anything changed in SQL Server Management Studio will be traced by the SQL Profiler. So it can basically be used for database performance check. We also have "SQL Server Performance Monitor" to monitor the System and Server performance too.
What You Must Know
When you begin profiling, the following guidelines will help you use the tool most effectively:
Note
Sending trace data directly to a SQL Server table can incur performance overhead. It is often better to trace to a file and then import the data to a table later.
To save trace output to a file from the trace output window, click Save As on the File menu, click Trace File, and then specify a file location and a name. Trace files are given the .trc extension.
To capture output directly to a file, specify the file name details on the General tab of the Trace Properties dialog box. You should also set the maximum file size to prevent the file from growing indefinitely. Then when the file reaches the maximum size, a new file will be created.
The following statement creates a table named 1108 in the current database and imports the trace information from MyTrace.trc into that table.
SELECT * INTO trace1108 FROM ::fn_trace_gettable('C:\MyTrace.trc', default)
Isolating a Long-Running Query with SQL Profiler
If your application has a performance problem that you think might be caused by a particularly long-running query, you can use the SQLProfilerTSQL_Duration template to analyze query durations. You can either analyze the queries interactively, or you can save information to an output file and analyze the data offline.
Identifying a Long-Running Query Interactively The most immediate way of analyzing query performance is to use SQL Profiler to show trace information interactively.
To identify a long-running query interactively
1.Start SQL Profiler.
2.On the File menu, click New, and then click Trace.
3.Specify the relevant connection details to connect to the computer running SQL Server.
The Trace Properties dialog box appears.
4.In the Template name list, click SQLProfilerTSQL_Duration.
5.Click the Events tab.
Notice that two key events are selected:
- RPC:Completed from the Stored Procedures event class
- SQL:BatchCompleted from the T-SQL event class
6.Click Run to run the trace.
7.Start SQL Query Analyzer.
8.Run the queries you want to analyze. For example, using the Pubs database, you might run the following query.
1 2 3 | |
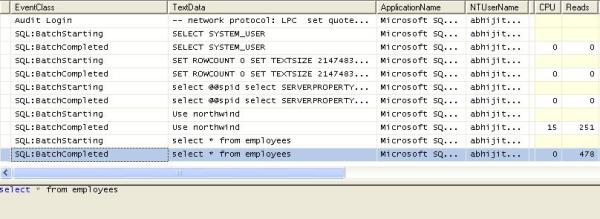
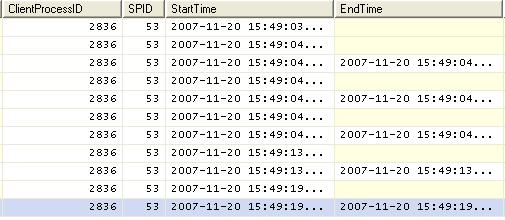
9.View the trace output in SQL Profiler. Note that durations are given in milliseconds.
Figure 1 shows sample output.
Figure 1: Sample SQL Profiler output using the SQLProfilerTSQL_Duration template
10.Stop the trace.
Note
Your duration times may vary from those shown, and may even appear as zero if the database server has a small load.
Filtering Events
You can use a filter to view only those queries that take longer than a specified duration.
To filter based on duration
1.Stop the trace if it is currently running, either by clicking the Stop selected trace icon on the toolbar or by clicking Stop Trace on the File menu.
2.On the File menu, click Properties. The Trace Properties dialog box appears.
3.On the Filters tab, expand Duration from Trace event criteria, and then expand Greater than or equal to and enter a value.. A value of 1000 milliseconds, for example, would cause the filter to show only those queries that take longer than one second to run.
4.Click Run.
5.Run the queries you want to analyze. For example, using the Pubs database:
1 2 3 | |
6.Using SQL Profiler, view the trace data. Only information satisfying the filter is captured.
After capturing trace information, you can click the Duration column in the output window to sort in order of duration. You can view the slowest-running queries in the TextData column.
Note
If no queries match the filter, you may need to lower the value for the Greater than or equal to value.
Tracking Heavily Used Stored Procedures
If your application uses numerous stored procedures, you may want to target your fine-tuning to those stored procedures that are used most heavily. The SQLProfilerSP_Counts template aids in this process, as described in the steps that follow.
To track heavily used stored procedures
1.Start SQL Profiler.
2.On the File menu, click New, and then click Trace.
3.Specify the relevant connection details to connect to the computer running SQL Server. The Trace Properties dialog box appears.
4.In the Template name list, select SQLProfilerSP_Counts.
5.Click Run to run the trace.
Running the trace displays the following events: EventClass, ServerName, DatabaseID, ObjectID and SPID.
The most frequently referenced ObjectIDs are listed first.
6.You can now run your client application and begin database profiling. Figure 2 shows sample output.
Figure 2: Sample SQL Profiler output using the SQLProfilerSP_Counts template
Identifying Stored Procedures
To find the name of the stored procedure given a specific ObjectID, you can use the following query. Replace
1 | |
Identifying Execution Duration
If you want to find out how long a stored procedure took to run, you need to capture the SP:Completed event. To identify the execution duration of individual statements within a stored procedure, use SP:StmtCompleted.
To identify stored procedure execution duration
1.Stop the trace if it is already running.
2.On the File menu, click Properties.
3.On the Events tab, expand the Stored procedures event class present in the Available Event Class list box and select SP:Completed.
4.Click Add, and then click Run.
5.Run the stored procedures you want to analyze. For example, using SQL Query Analyzer and the Pubs database:
1 | |
SQL Query Analyzer displays a list of stored procedure executions.
To identify statement execution duration within a stored procedure
1.Stop the trace if it is already running.
2.On the File menu, click Properties.
3.On the Events tab, expand the Stored Procedures event class and select SP:StmtCompleted.
4.Click Add, and then click Run. SQL Profiler shows statement and stored procedure execution.
5.Run the stored procedures you want to analyze. For example, using SQL Query Analyzer and the Pubs database:
1 | |
SQL Query Analyzer displays a list of statement executions.