SQL Query Execution Plan
Understanding and reading the Query Execution plans
In the previous parts of this series, we explained what SQL Server query execution plans were, why they should be used, and presented various methods to show them. In this part, we will explain the symbols used, how to read the plans, and how to use these plans in performance analysis and troubleshooting
Statement and query execution in a graphical query execution plan is shown by icons. Each icon has a specific color and represents a specific action. As shown in Viewing the plans, query execution plans can also be shown as XML. Graphical presentation provides quick understanding of the basic plan characteristics and structure, therefore is useful for performance analysis. It also provides enough information for deeper analysis
General guidelines for reading a SQL Server query execution plan
Operators show how queries and statements are executed. They can be physical and logical. Logical operators present an operation on a conceptual level, while physical operators implement the operation defined by the logical operator using a specific method. In other words, a physical operator is an object or routine that executes an operation. Physical operators access columns and rows in tables and views, calculate expressions, create joins, etc.
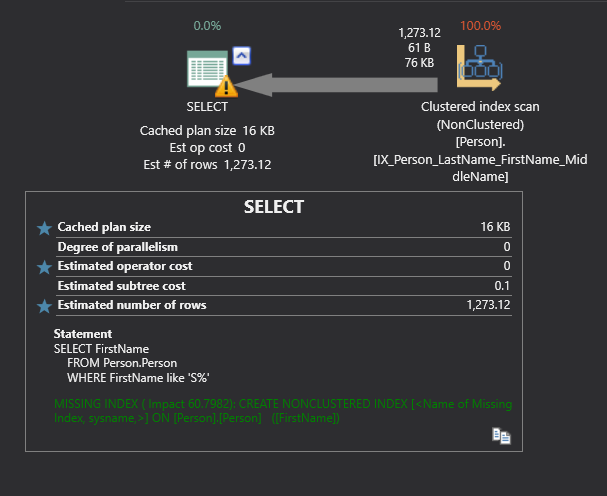
If there is any kind of warning, it will be indicated by the yellow triangle on the icon. The warning text is shown in the operator tooltip
Most commonly used operators and their graphical execution plan icons
There are more than 70 different graphical execution plan icons used in query execution plans. The most commonly used are:
 The Language Element Catchall operator, shown when the adequate icon for the operator used cannot be found. It doesn’t indicate an error
 The Result operator, shows the results returned
 The nested loop operator, shows inner, left outer, left semi, and left anti semi joins
 The Non-clustered Index Delete operator, deletes rows from a non-clustered index
 The Non-clustered Index Insert operator, inserts rows into the non-clustered index
 The Non-clustered Index Scan operator, reads all rows from the non-clustered index
 The Non-clustered Index Seek operator, doesn’t scan the whole table/view to read the necessary records, but uses indexes to seek for specific data
Similar graphical execution plan icons exist for clustered index operators
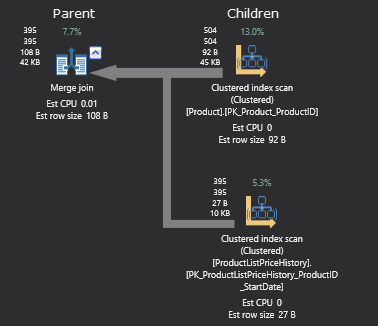
Based on the statement type, query execution plan trees have different structure
T-SQL statements and stored procedures are presented as tree roots. Statements called by the stored procedure are presented as children in the tree
1 | |
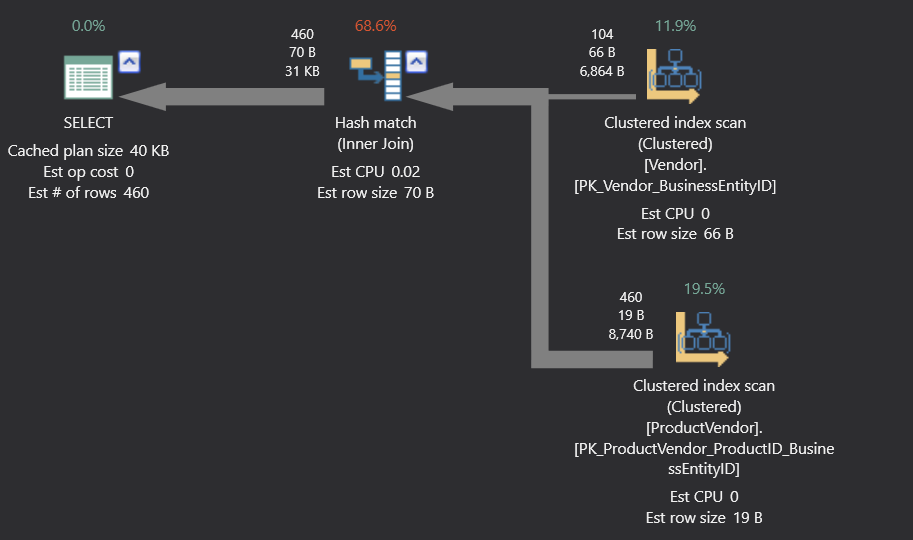
Data manipulation language (DML) statements SELECT, INSERT, DELETE, and UPDATE are also presented as tree roots. The first child represents the execution plan for the statement. If the statement fires a trigger, it’s represented as the second child
1 2 | |
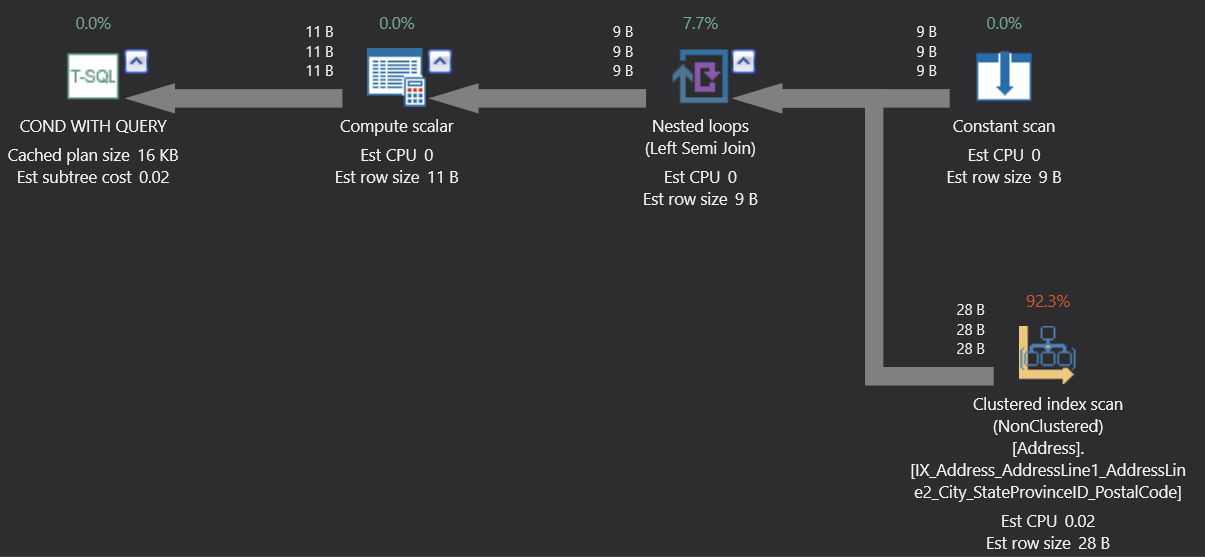
The conditional statements, such as IF…THEN…ELSE are presented with 3 children. WHILE and DO-UNTIL statements are represented similarly
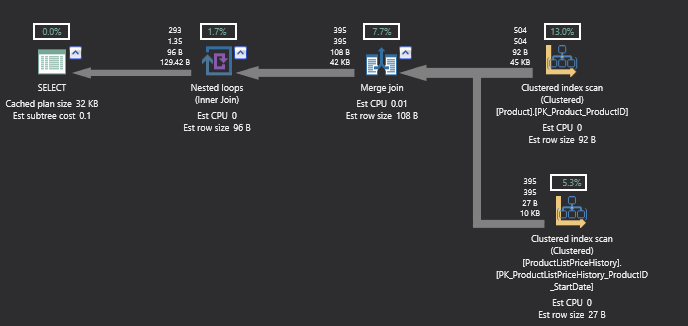
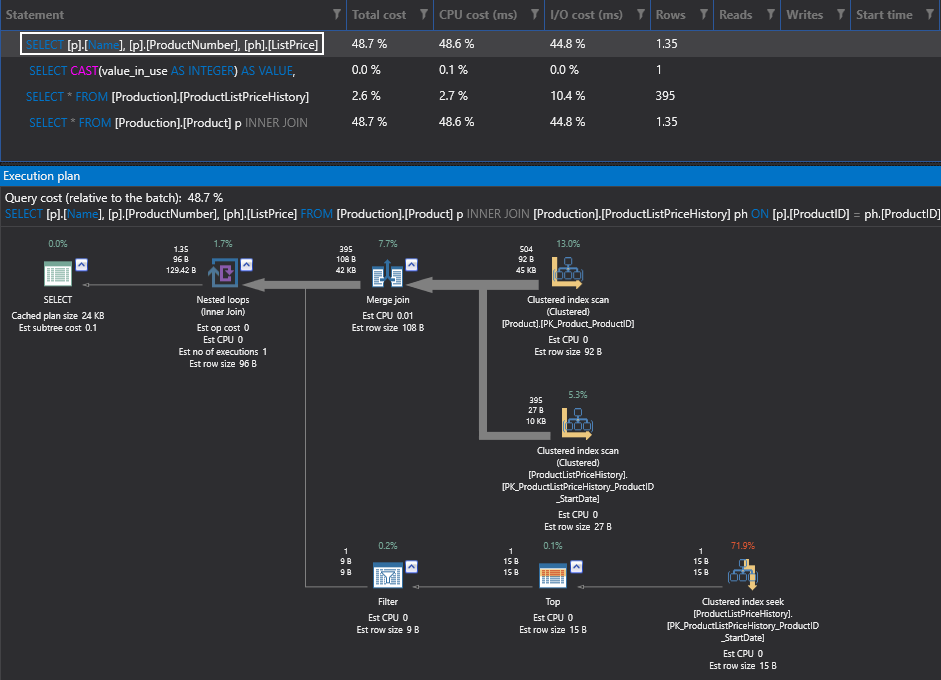
Estimated execution plan
1 2 3 4 5 6 7 8 9 | |
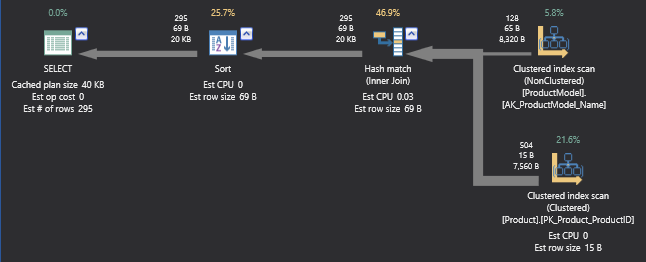
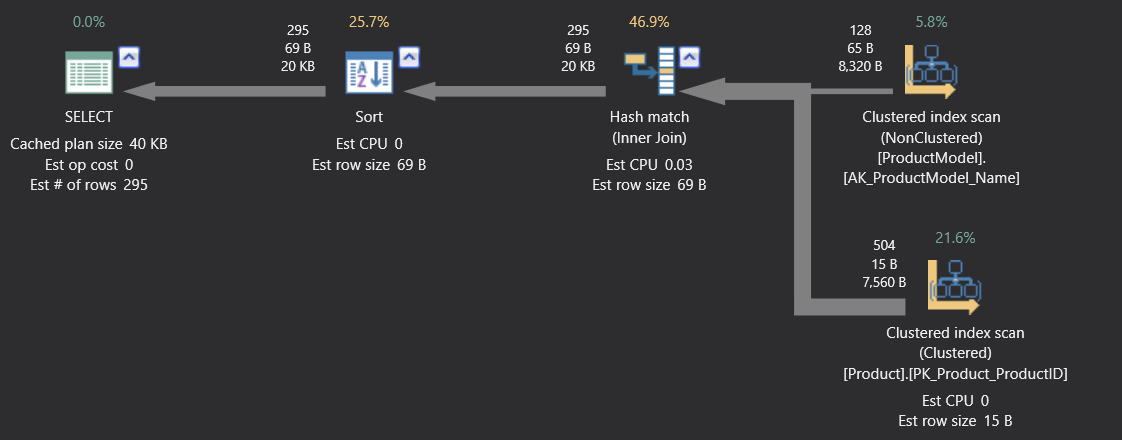
Relational operators, such as table scans, aggregations, and joins are presented in the tree as nodes
1 2 3 4 | |
The DECLARE CURSOR statement is shown as the tree root. The statement it refers to is shown as a child
1 2 3 4 | |
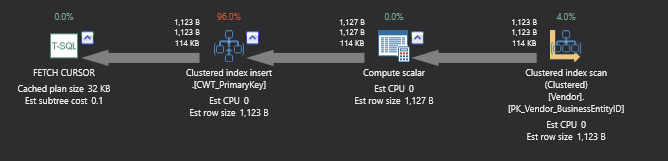
As shown in the examples above, the icon color is different – icons for language elements (SELECT, Condition with query, Delete, etc.) are green, logical and physical operator icons are blue, and cursor icons are yellow
Operator tooltips
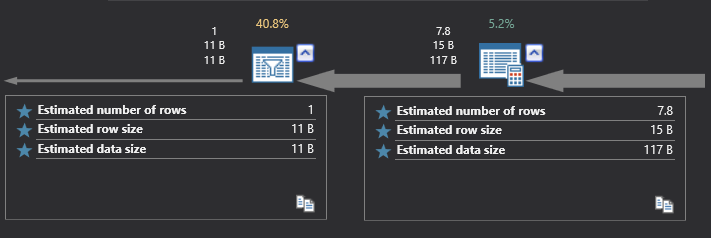
Besides the information presented by the icons and nodes, SQL Server query execution plans provide much more details in the icon tooltips. To see the tooltip place the mouse over the icon in the execution plan and include or exclude the desired property by clicking the star.
The information shown in tooltips is various and depends on the operator type. The items shown in the tooltips are different for actual and estimated plans. The tooltip on the left is for the actual and on the right for the estimated plan for the same operator
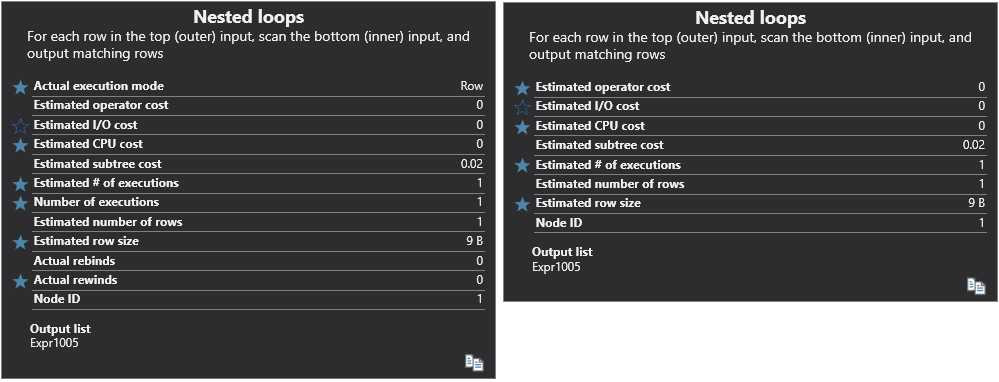
The estimated and actual values for the same parameters may not be equal in some scenarios
The information available in a tooltip is:
Estimated operator cost – the cost of the operation, presented as a percentage of total batch cost
Estimated I/O cost, Estimated CPU cost – Query analyzer creates several execution plans, calculates the cost of each (how much I/O and processor resources are needed to complete the operation), and determines the most efficient one
Estimated row size – the number of rows that is believed to be affected by the operation, useful for determining how much memory is needed
Actual and Estimated number of rows – even if there is significant discrepancy between these two values, it doesn’t indicate a problem. It’s usually caused by out of date statistics
Actual and Estimated execution mode – row or batch, shows whether the rows are processed one at a time, or in batches
In this article, we presented the basic query execution plan elements and tree structures, commonly used graphical execution plan icons, and most important information shown in the tooltips. In the next part of this series, we will show query execution plan examples with T-SQL code, explain their structure, elements, and cost